Home / Class 10 Math / Ch 14 Statistics- MCQ Online Test 3 Class 10 Maths
Chapter 14 Statistics- MCQ Online Test 3 Class 10 Maths
1.Construction of cumulative frequency table is useful to determine
Mean
Median
Mode
All the above
2. What is the middle most value of the data?
Median
Mean
Mode
None of these
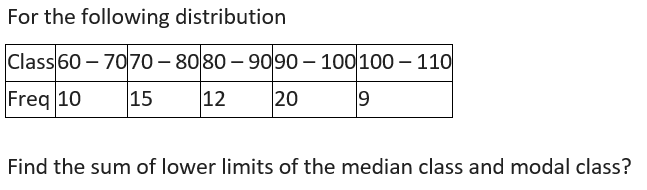
3. For the following distribution
Class
60-70
70-80
80-90
90-100
100-110
Frequency
10
15
12
20
9
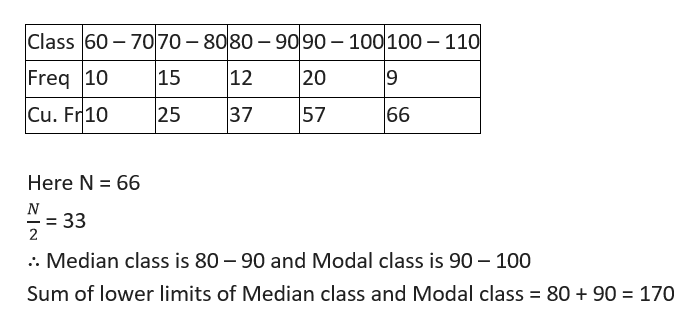
Find the sum of lower limits of the median class and modal class
170
260
320
450
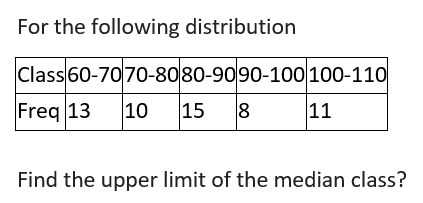
4. For the following distribution
Class
60-70
70-80
80-90
90-100
100-110
Frequency
13
10
15
8
11
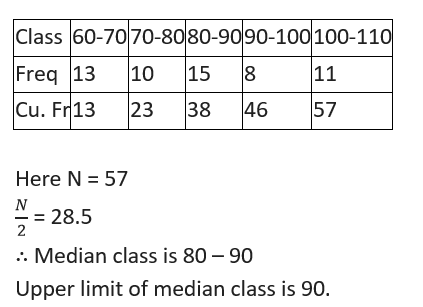
Find the upper limits of the median class.
120
180
90
160
5. What is the middle most value of the data?
Median
Mode
Mean
All of these
6. For a symmetrical distribution what defines mean?
Mean < Mode < Median
Mean > Mode > Median
Mean = Median = Mode
None of these
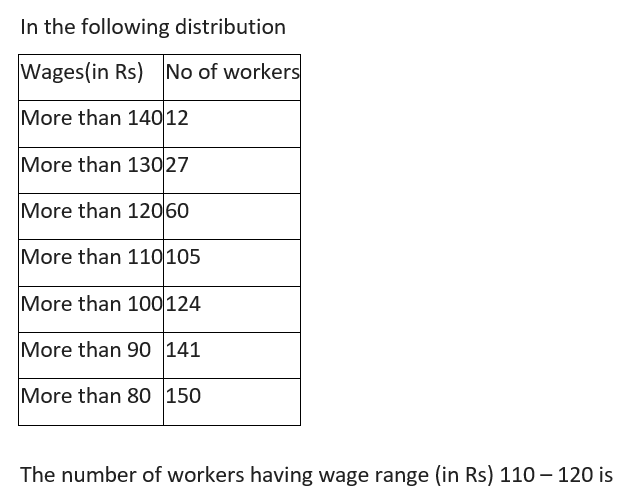
7. In the following distribution
Wages (in Rs)
No. of workers
More than 140
12
More than 130
27
More than 120
60
More than 110
105
More than 100
124
More than 90
141
More than 80
150
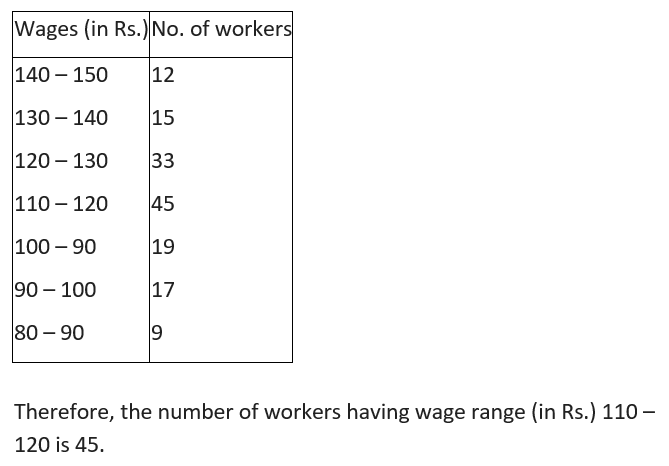
The number of workers having wage ranges (in Rs) 110-120 is
8. The abscissa of the point of intersection of the less than type and of the more than type o gives of a grouped data gives its
Median
Mode
Mean
All of these
9. To represent ‘the more than type’ graphically, we plot the ____________ on the x – axis.
Upper limits
Class marks
Lower limits
Class size
10. Which of the following is not a measure of central tendency?
Mode
Arithmetic mean
Median
Standard deviation
Chapter - 14 Statistics Quiz-3 | Math Class 10th
Time limit: 0
Quiz-summary
0 of 10 questions completed
Questions:
1
2
3
4
5
6
7
8
9
10
Information
Click on ‘Start Quiz’ to Take Test.
You have already completed the quiz before. Hence you can not start it again.
Quiz is loading...
You must sign in or sign up to start the quiz.
You have to finish following quiz, to start this quiz:
Results
0 of 10 questions answered correctly
Your time:
Time has elapsed
You have reached 0 of 0 points, (0)
Categories
Not categorized0%
1
2
3
4
5
6
7
8
9
10
Answered
Review
Question 1 of 10
1. Question
Construction of cumulative frequency table is useful to determine
Correct
Construction of cumulative frequency table is useful to determine Median. It is the Y axis of the point where, X-axis, i.e. frequency axis is N/2, N is total number of observations.
Incorrect
Construction of cumulative frequency table is useful to determine Median. It is the Y axis of the point where, X-axis, i.e. frequency axis is N/2, N is total number of observations.
Question 2 of 10
2. Question
What is the middle most value of the data?
Correct
The median of a set of data values is the middle most value when the data has been arranged in ascending order i.e. from smallest value to the largest value.
Incorrect
The median of a set of data values is the middle most value when the data has been arranged in ascending order i.e. from smallest value to the largest value.
Question 3 of 10
3. Question
Correct
Incorrect
Question 4 of 10
4. Question
Correct
Incorrect
Question 5 of 10
5. Question
What is the middle most value of the data?
Correct
The median of a set of data values is the middle most value when the data has been arranged in ascending order i.e. from smallest value to the largest value.
Incorrect
The median of a set of data values is the middle most value when the data has been arranged in ascending order i.e. from smallest value to the largest value.
Question 6 of 10
6. Question
For a symmetrical distribution what defines mean?
Correct
If a frequency distribution has a symmetrical frequency curve, then mean, median and mode are equal.
However an empirical relationship exists between mean, median and mode. For moderately skewed data distribution.
For a symmetrical distribution Mean = Median = Mode
Incorrect
If a frequency distribution has a symmetrical frequency curve, then mean, median and mode are equal.
However an empirical relationship exists between mean, median and mode. For moderately skewed data distribution.
For a symmetrical distribution Mean = Median = Mode
Question 7 of 10
7. Question
Correct
Incorrect
Question 8 of 10
8. Question
The abscissa of the point of intersection of the less than type and of the more than type o gives of a grouped data gives its
Correct
The abscissa of the point of intersection of the less than type and of the more than type o gives of a grouped data gives its Median.
Since the point of intersection of the more than type o give and less than type o give gives the median on the x – axis.
Incorrect
The abscissa of the point of intersection of the less than type and of the more than type o gives of a grouped data gives its Median.
Since the point of intersection of the more than type o give and less than type o give gives the median on the x – axis.
Question 9 of 10
9. Question
To represent ‘the more than type’ graphically, we plot the ____________ on the x – axis.
Correct
The lower limit for every class is the smallest value in that class on the hand the upper limit for every class is the greatest value in that class.To represent ‘the more than type’ graphically, we plot the lower limits on the x – axis and cumulative frequency on the y – axis to find the median
Incorrect
The lower limit for every class is the smallest value in that class on the hand the upper limit for every class is the greatest value in that class.To represent ‘the more than type’ graphically, we plot the lower limits on the x – axis and cumulative frequency on the y – axis to find the median
Question 10 of 10
10. Question
Which of the following is not a measure of central tendency?
Correct
The most common measures of central tendency are mean, median and mode.
Standard deviation is a measure of the dispersion of a set of data from its mean. It is calculated as the square root of variance.
Hence standard deviation is not a measure of central tendency.
Incorrect
The most common measures of central tendency are mean, median and mode.
Standard deviation is a measure of the dispersion of a set of data from its mean. It is calculated as the square root of variance.
Hence standard deviation is not a measure of central tendency.